These city-owned parking lots can be found throughout Portland, with nearly half located on the city’s west side.
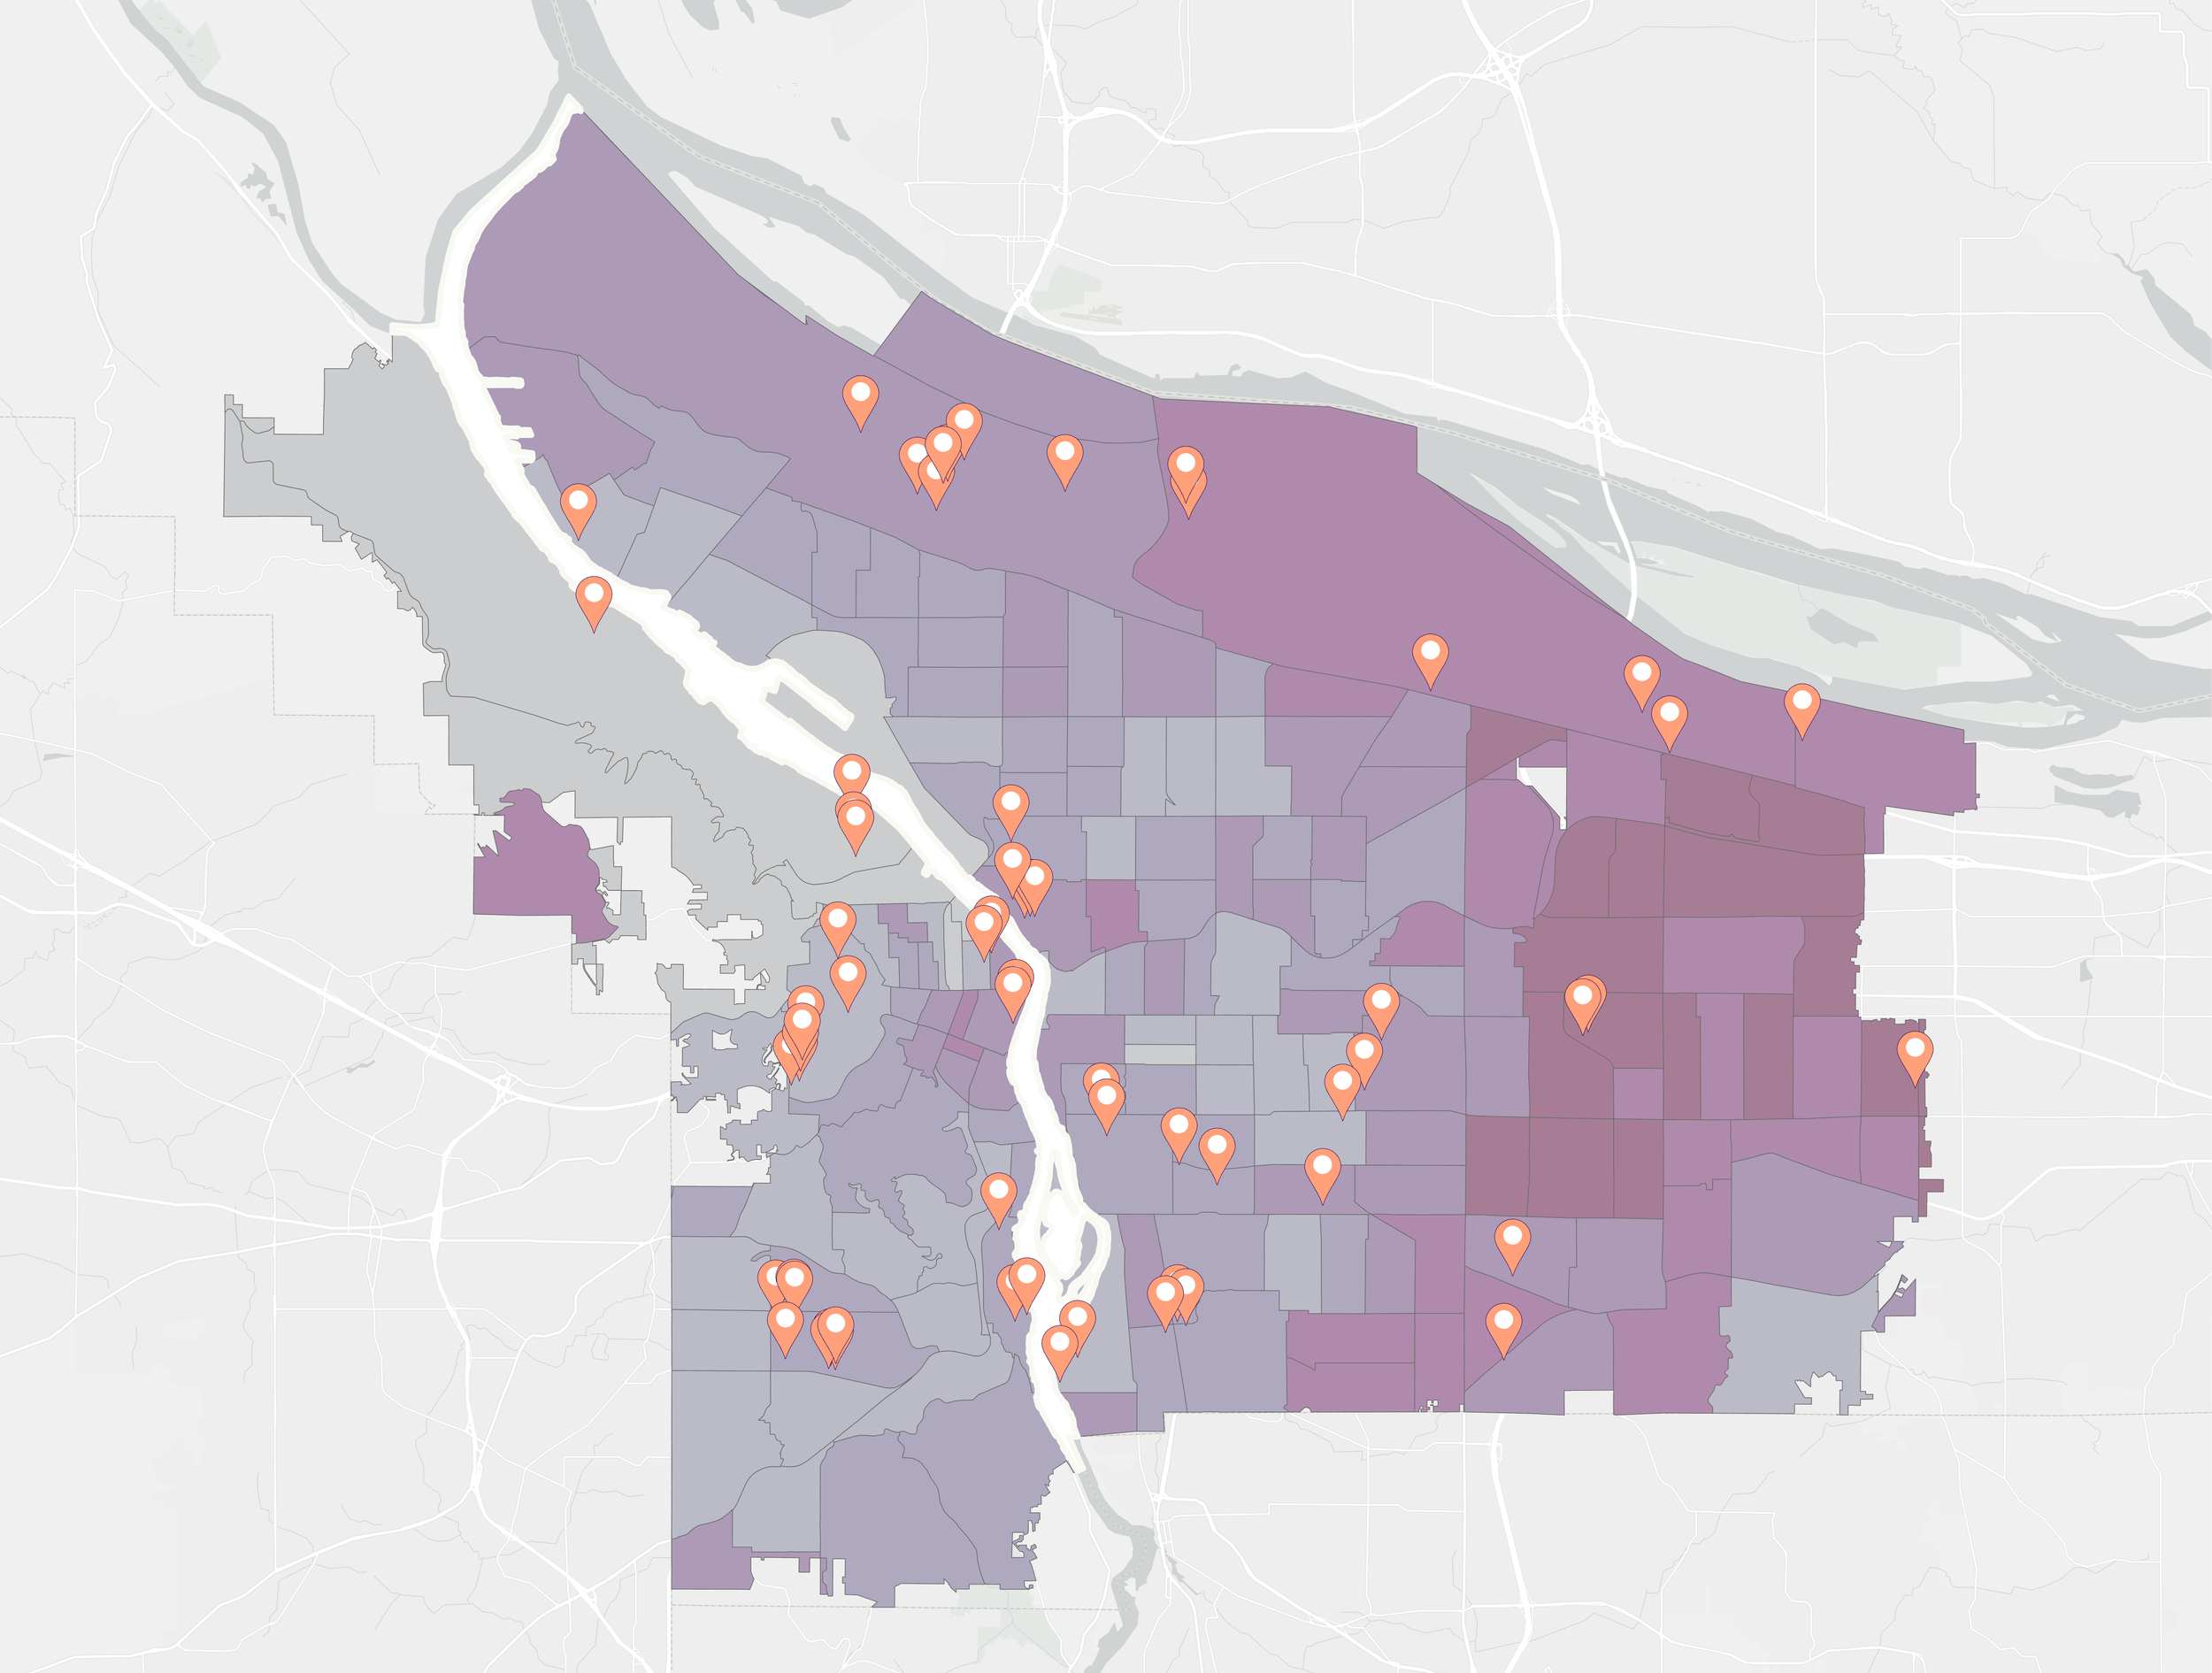
Map with purple shaded areas and orange location markers showing the locations of Portland's city-owned parking lots.

This map shows the locations of 70 city-owned parking lots across Portland. Some parking lots are located in hotter, less-shaded areas where heat exposure is highest, while others are in cooler areas full of trees. The city should consider the best ways to address uncovered parking lots throughout the city, while prioritizing the neighborhoods that need relief first.
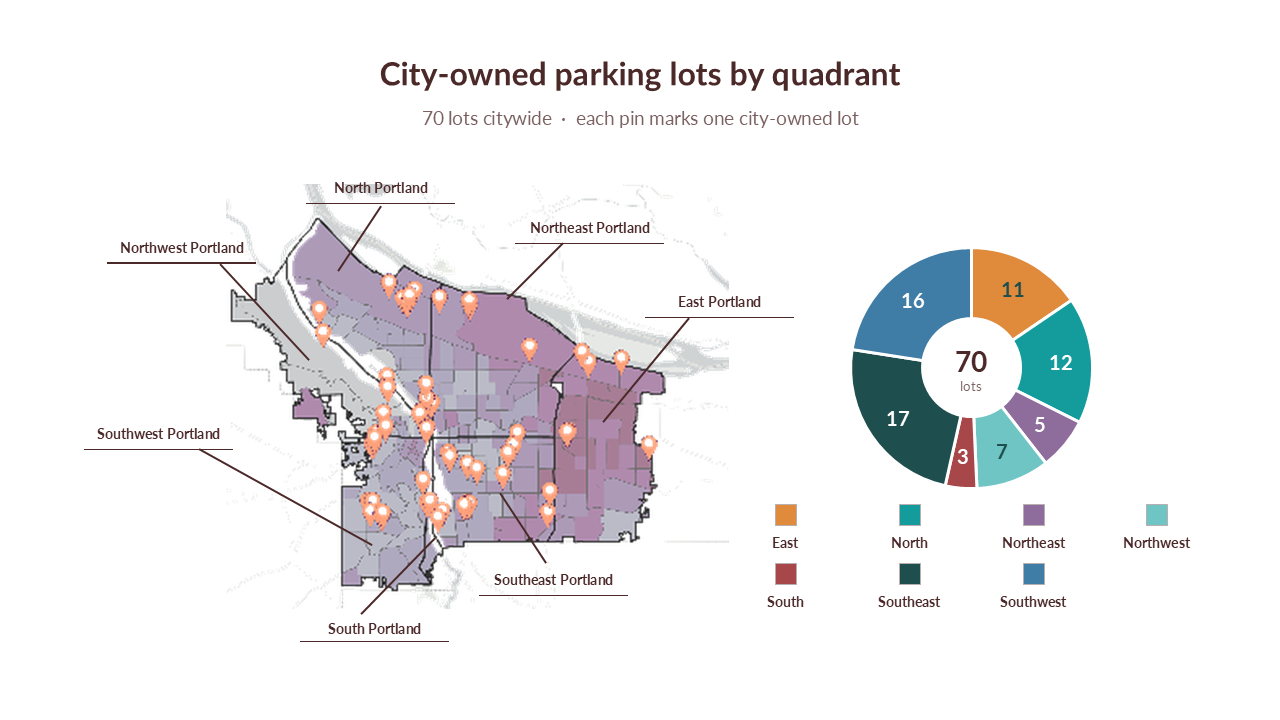
Map of Portland divided into city-owned parking lots by quadrant, with numbered pins indicating lot locations. A color-coded pie chart shows 70 parking lots divided among North, Northeast, East, Southeast, South, Southwest, and Northwest Portland.

70 city-owned parking lots shown across Portland’s seven quadrants.
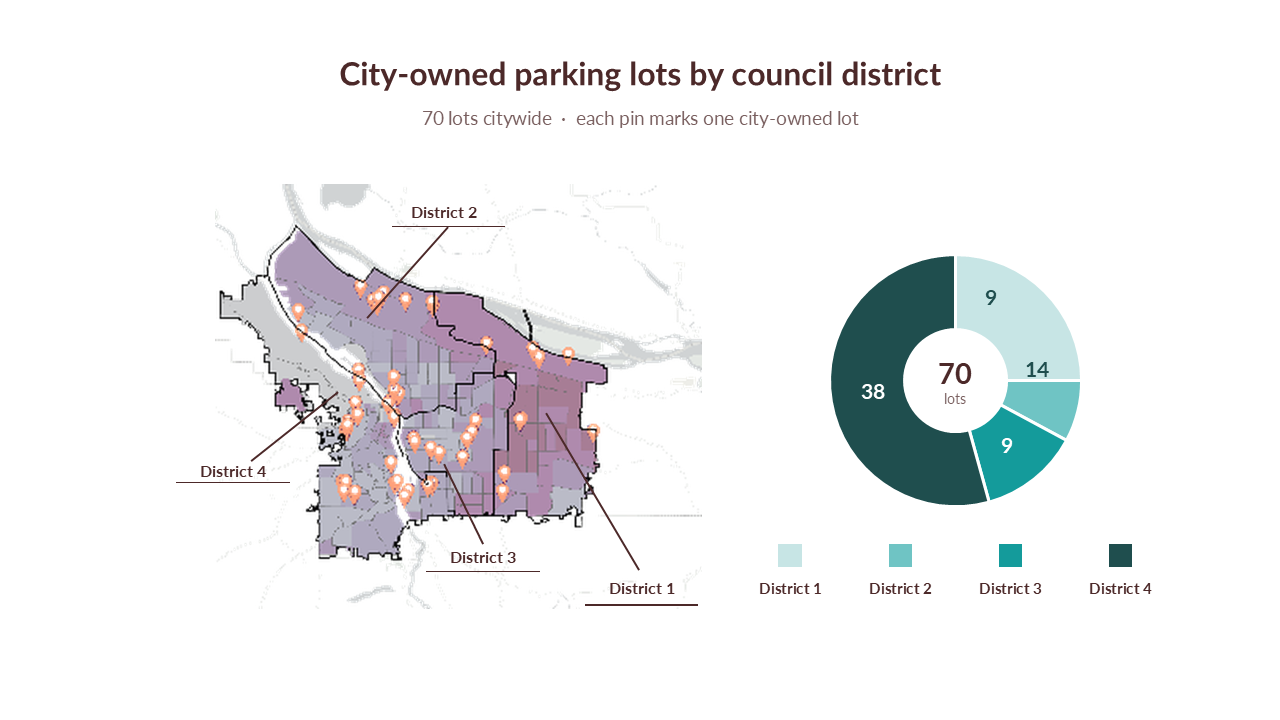
Map showing city-owned parking lots by council district with a pie chart displaying the number of lots per district. Districts are labeled 1 through 4, with each district color-coded.

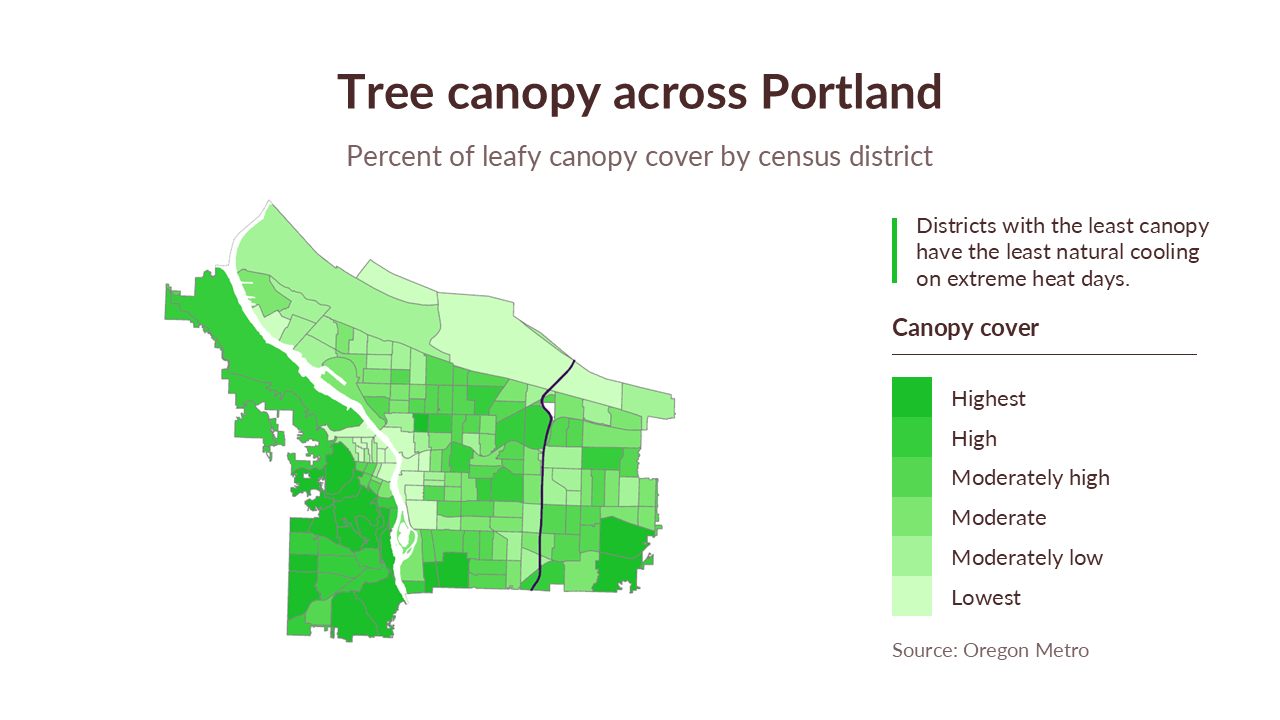
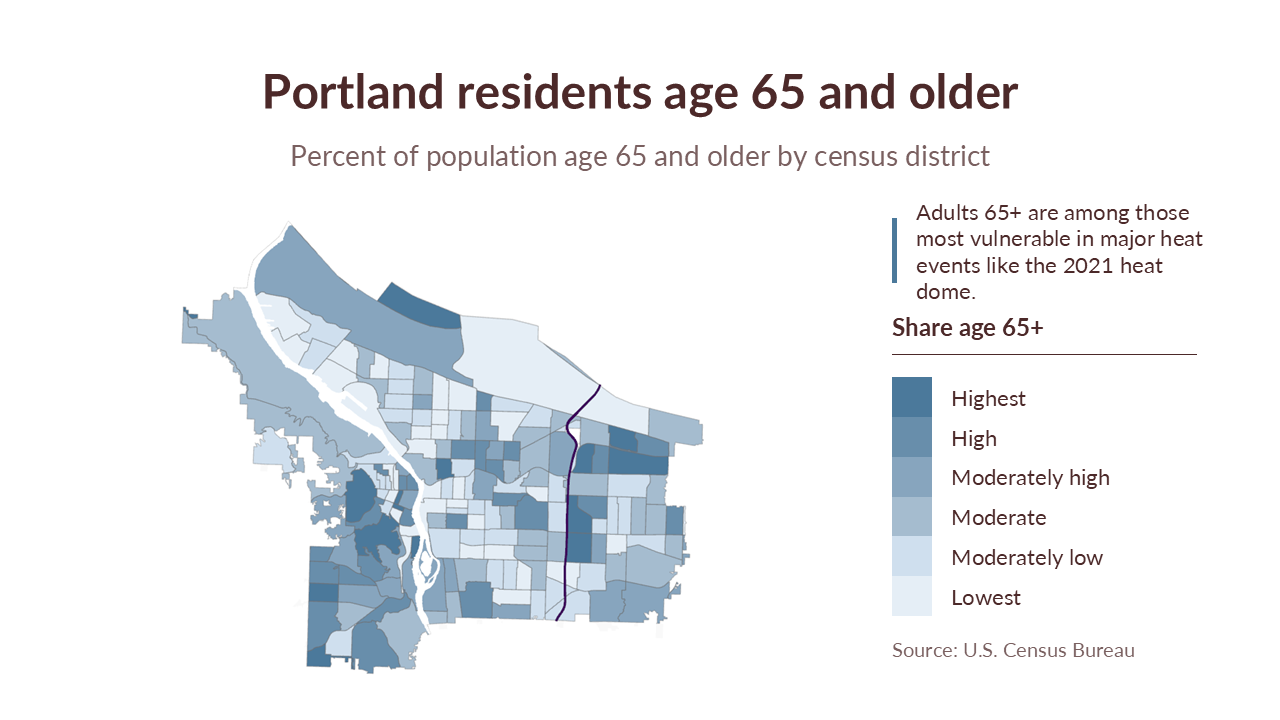
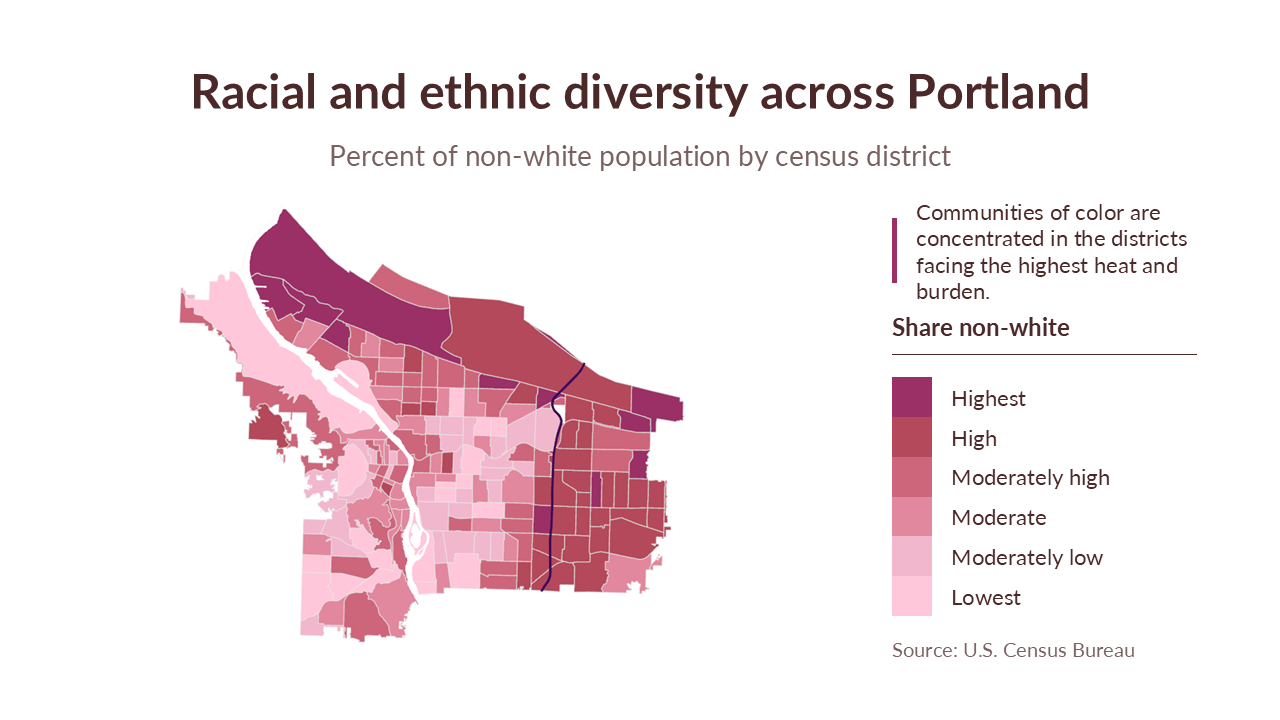
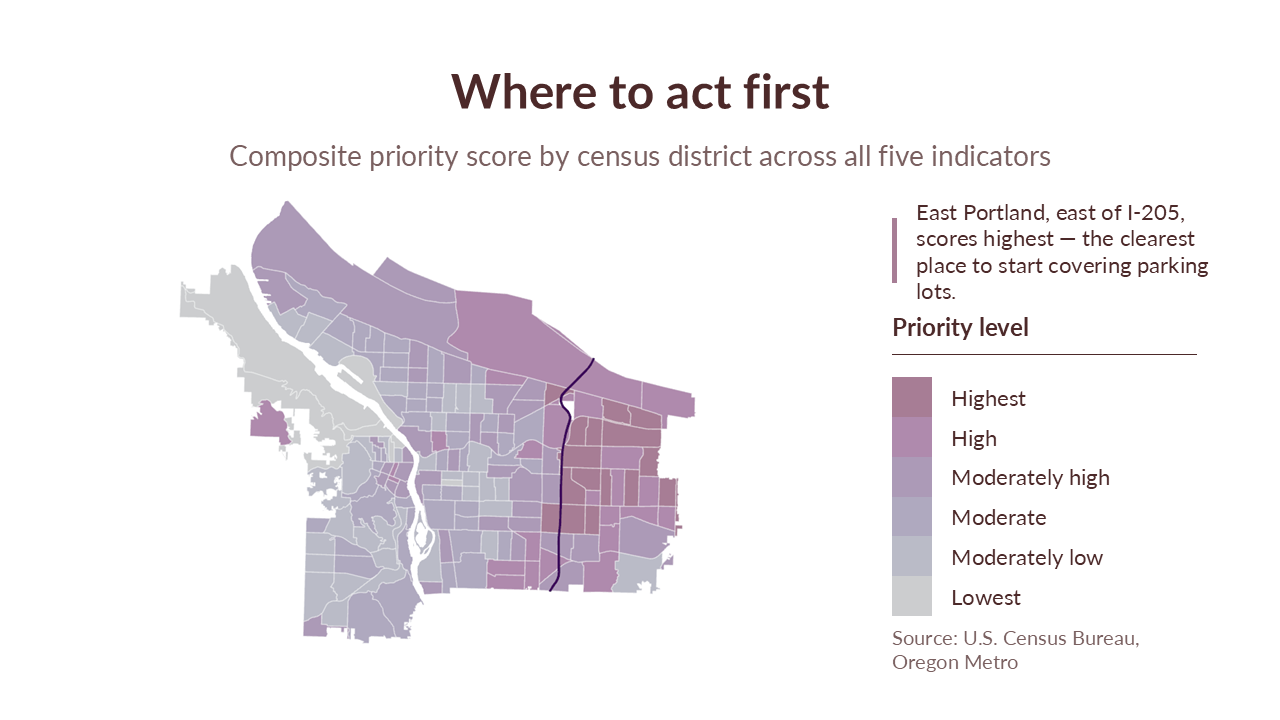
These maps show demographic variables throughout Portland and the areas with the greatest need to address uncovered parking lots.
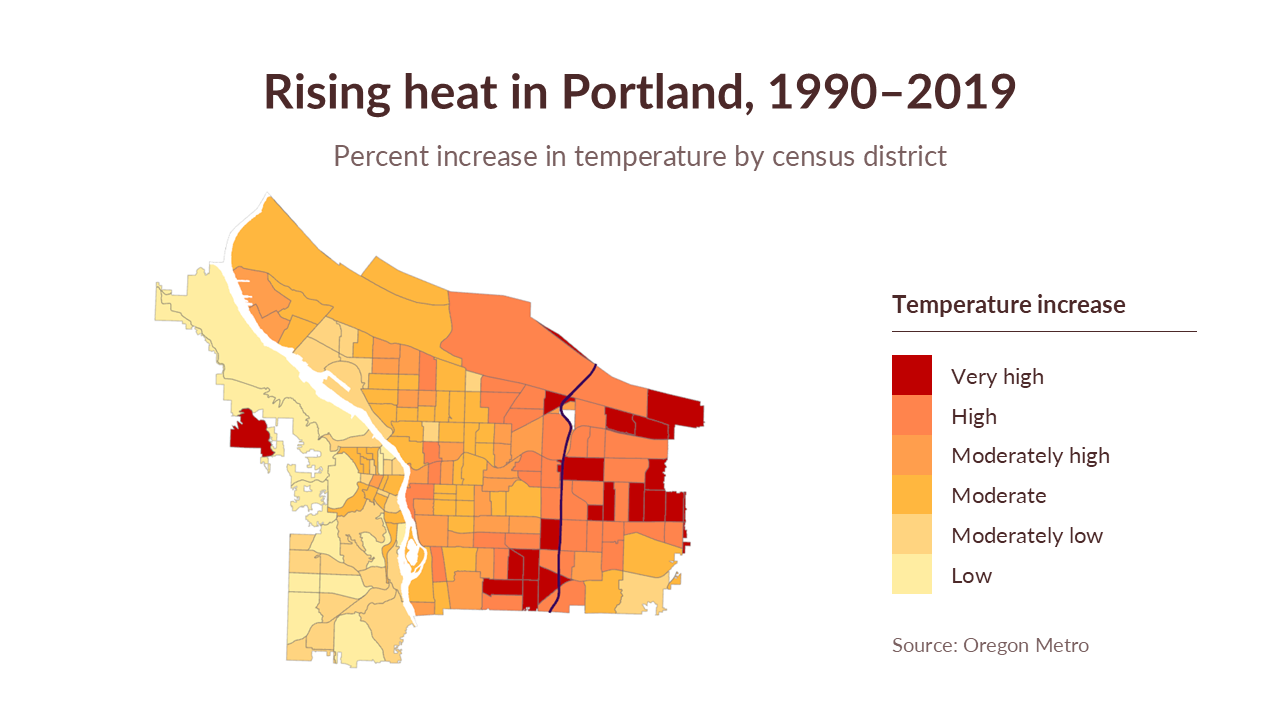
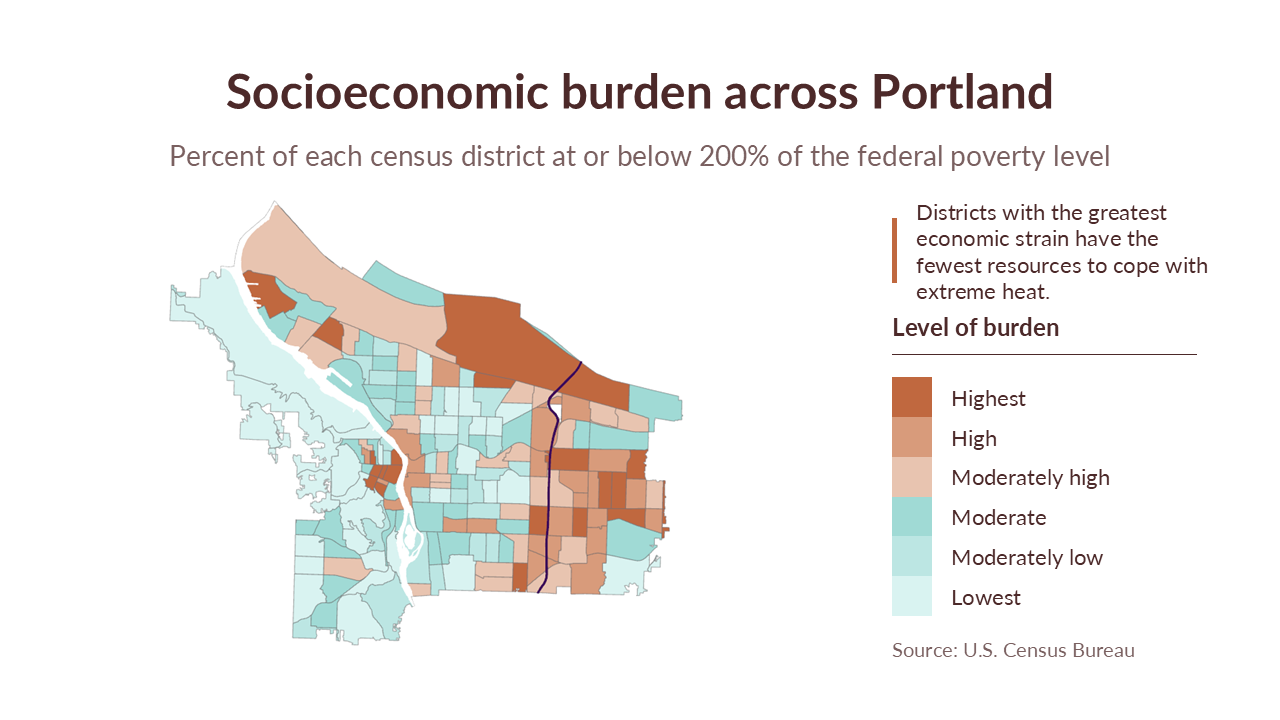
Map of Portland showing percent increase in temperature from 1990 to 2019, with color coding from low to very high.
Map illustrating socioeconomic burden across Portland, showing census districts at or below 200% of federal poverty level with varying levels of resource strain, color-coded from lowest to highest burden.
Map of Portland showing tree canopy cover percentages by district, with a title 'Tree canopy across Portland,' a subtitle explaining the data, a legend indicating canopy cover levels from highest to lowest in shades of green, and an annotation about districts with least canopy cover having minimal cooling on extreme heat days. The map is sourced from Oregon Metro.
Map of Portland showing the percentage of residents aged 65 and older by census district, with a color gradient from lowest to highest percentage. Title indicates older adults are vulnerable to heat events. Source: U.S. Census Bureau.
Map of Portland displaying racial and ethnic diversity, with districts shaded in various shades of purple from lowest to highest non-white population, based on U.S. Census data.
Map of Portland, Oregon showing census districts color-coded by priority level, with east Portland on the right having the highest scores, and a legend indicating levels from lowest to highest.
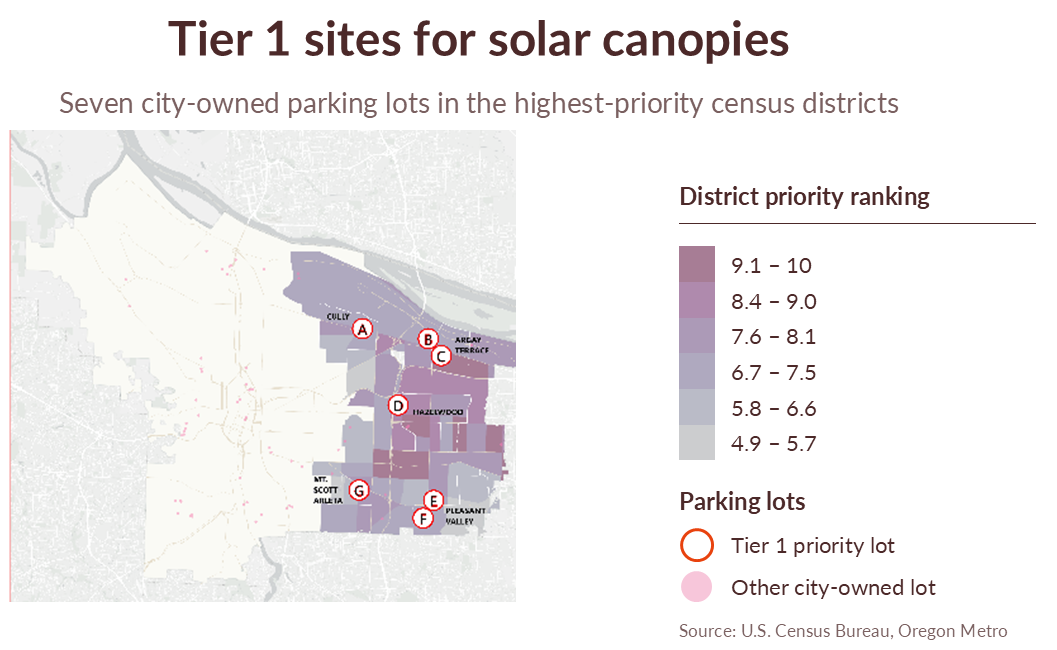
Map showing seven city-owned parking lots designated as Tier 1 sites for solar canopies, labeled A through G, with district priority rankings indicated by shades of purple, ranging from 4.9 to 10.
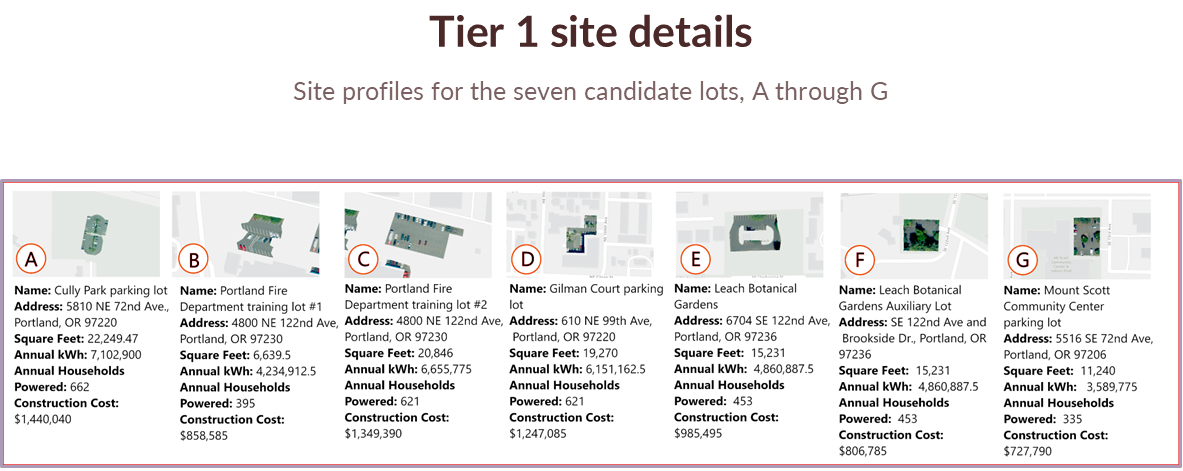
Chart listing site details and statistics for seven candidate lots labeled A through G, including names, addresses, square footage, annual household counts, power usage, and construction costs.

Further details about the city-owned parking lots identified as Tier 2 and Tier 3 sites to be covered by solar canopies can be found in the Executive Summary. Profiles of each of the 63 city-owned parking lots can be found on this project’s StoryMap.